[displayFn] chartjs

Chartjs 스크립트를 그대로 사용하고 싶을때 displayFn과 함께 사용할 수 있습니다.

display: chartjs

  • chartjs 스크립트를 사용할 수 있습니다.
  • ChatGPT 등을 통해 더 잘 활용할 수 있습니다. (e.g. “chartjs로 bar 그리는 js 코드를 알려줘”)

displayFn

  • block.id와 displayFn안에 차트를 그릴때 ID가 동일해야합니다.
  • sqlMany 기능이 추가되었습니다. (여러개 쿼리 실행시 rows[0], rows[1] 안에 각각 결과가 담깁니다: 지난주/이번주 데이터 비교 등에 사용 가능)
  • displayFn안에서 쓸수있는 변수: rows, id, openModal, openAction, _ lodash 데이터 처리용

예시 YAML 코드

image

menus:
- path: pages/8y_rbk-6
  name: Chartjs
pages:
- path: pages/8y_rbk-6
  # title: 제목
  # subtitle: 내용
  blocks:
  - type: query
    resource: mysql.qa
    sqlType: select
    sql: >
      SELECT DATE(created_at), COUNT(id) FROM TestLog 
      WHERE created_at > '2024-05-15'
      GROUP BY 1
    modals:
      - path: view
        blocks:
          - type: query
            resource: mysql.qa
            sqlType: select
            sql: SELECT :id
            params:
              - key: id
                valueFromRow: id
    display: chartjs
    displayFn: |
      const data = {
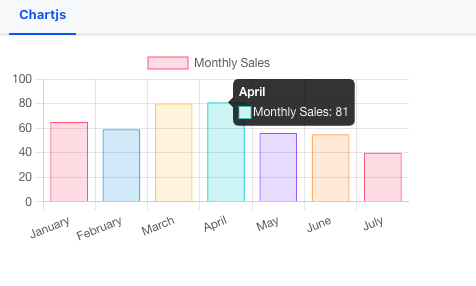
          labels: ['January', 'February', 'March', 'April', 'May', 'June', 'July'],
          datasets: [{
              label: 'Monthly Sales',
              data: [65, 59, 80, 81, 56, 55, 40],
              backgroundColor: [
                  'rgba(255, 99, 132, 0.2)',
                  'rgba(54, 162, 235, 0.2)',
                  'rgba(255, 206, 86, 0.2)',
                  'rgba(75, 192, 192, 0.2)',
                  'rgba(153, 102, 255, 0.2)',
                  'rgba(255, 159, 64, 0.2)',
                  'rgba(255, 99, 132, 0.2)'
              ],
              borderColor: [
                  'rgba(255, 99, 132, 1)',
                  'rgba(54, 162, 235, 1)',
                  'rgba(255, 206, 86, 1)',
                  'rgba(75, 192, 192, 1)',
                  'rgba(153, 102, 255, 1)',
                  'rgba(255, 159, 64, 1)',
                  'rgba(255, 99, 132, 1)'
              ],
              borderWidth: 1
          }]
      };

      const config = {
          type: 'bar',
          data: data,
          options: {
              scales: {
                  y: {
                      beginAtZero: true
                  }
              },
              onClick: (event, elements) => {
                  if (elements.length > 0) {
                      const element = elements[0];
                      const label = data.labels[element.index];
                      const value = data.datasets[element.datasetIndex].data[element.index];
                      // alert(`Label: ${label}\nValue: ${value}`);
                      openModal('view', {id: label})
                  }
              }
          }
      };

      const myBarChart = new Chart(ctx, config);
    

안녕하세요 @hbkim 님,

혹시 chartjs 플러그인을 추가할 수 있는 방법이 있을까요?

https://cdn.jsdelivr.net/npm/chartjs-plugin-datalabels@2.0.0

<샘플코드>

<!DOCTYPE html>
<html lang="en">
<head>
    <meta charset="UTF-8">
    <meta name="viewport" content="width=device-width, initial-scale=1.0">
    <title>Chart.js Stickiness Chart</title>
    <script src="https://cdn.jsdelivr.net/npm/chart.js"></script>
    <script src="https://cdn.jsdelivr.net/npm/chartjs-plugin-datalabels@2.0.0"></script>
    <style>
        body {
            display: flex;
            justify-content: center;
            align-items: center;
            height: 100vh;
            margin: 0;
        }
        #chart-container {
            width: 100%;
            max-width: 1200px; /* Optional: to limit maximum width */
        }
        canvas {
            width: 100% !important;
            height: auto !important;
        }
    </style>
</head>
<body>
    <div id="chart-container">
        <canvas id="stickinessChart"></canvas>
    </div>
    <script>
        const ctx = document.getElementById('stickinessChart').getContext('2d');
        const data = {
            labels: ['7/1', '7/2', '7/3', '7/4', '7/5', '7/6', '7/7', '7/8', '7/9', '7/10', '7/11', '7/12', '7/13', '7/14', '7/15', '7/16', '7/17'],
            datasets: [
                {
                    label: '일별 Stickiness',
                    data: [5.26, 10.53, 21.05, 26.32, 31.58, 21.05, 31.58, 42.11, 36.84, 26.32, 36.84, 30.00, 35.00, 31.61, 42.86, 36.13, 47.62],
                    backgroundColor: 'rgba(54, 162, 235, 0.2)',
                    borderColor: 'rgba(54, 162, 235, 1)',
                    borderWidth: 1,
                    type: 'bar',
                    datalabels: {
                        align: 'end',
                        anchor: 'end',
                        formatter: (value) => `${value}%`,
                        color: 'blue'
                    }
                },
                {
                    label: '목표',
                    data: [2.26, 4.52, 6.77, 9.03, 11.29, 13.55, 15.81, 18.06, 20.32, 22.58, 24.84, 27.10, 29.35, 28.57, 33.87, 33.33, 38.39],
                    backgroundColor: 'rgba(255, 99, 132, 0.2)',
                    borderColor: 'rgba(255, 99, 132, 1)',
                    borderWidth: 1,
                    type: 'line',
                    datalabels: {
                        align: 'top',
                        anchor: 'end',
                        formatter: (value) => `${value}%`,
                        color: 'red'
                    }
                }
            ]
        };

        const options = {
            responsive: true,
            maintainAspectRatio: false,
            scales: {
                y: {
                    beginAtZero: true,
                    max: 80
                }
            },
            plugins: {
                datalabels: {
                    display: true
                }
            }
        };

        const stickinessChart = new Chart(ctx, {
            type: 'bar', // Ensure this is set to 'bar' to handle mixed chart types
            data: data,
            options: options,
            plugins: [ChartDataLabels]
        });
    </script>
</body>
</html>

플러그인을 추가하면 그래프가 정상 표시되지 않습니다. 플러그인 코드를 제거하면 다음과 같이 정상적으로 표기됩니다.

image

안녕하세요! layout키에 script를 넣었을때 동일하실까요?

script 넣는 방법

@hbkim 학범님 회신이 늦었네요 :pray:

테스트를 해봤는데 잘 안되네요…! 현재는 billboardjs가 생각하고 있는 용도에 더 적합하다 생각되어서 billboardjs 사용해 보고 있습니다. 또 궁금한 점이 있다면 문의 남기겠습니다.

감사합니다.

확인 감사합니다! 네 편하게 문의 남겨주세요 :smiley: